

AFP Defined Risk Strategy is designed to help limit large losses from short-term fear selling in the stock market.
It is a stop-loss process that is triggered when the stock market trades below its recent average range. (We sell stock positions on this trigger.) History shows us that most large losses occur when the stock market trades below its 200-day moving average and when short term volatility spikes up. By selling stocks at these transition points, we seek to sit out until whatever is causing the market problems subsides.
How Does It Work?
We apply this Defined Risk approach to a portion of stocks within diversified portfolios. If the market trades above or below tactical triggers, we buy or sell these stocks. We separate domestic and international stock trends, and apply different triggers to each. Once the market moves back into "normal or average trading ranges", we re-establish core stock holdings. In January 2021, in order to reduce the quantity of trades and the corresponding tax reporting on trades in taxable accounts, we migrated our strategy into an ETF (Global X Adaptive Wealth ONOF) so that tactical moves would no longer trigger capital gains.
Global X Adaptive U.S. Risk Management ETF (ONOF) provides a risk management solution by employing four technical indicators dictate whether the index is participating in the U.S. equity markets or in a defensive stance in short term treasuries.


A Closer Look at the Four Signals - Here is a closer look at the 4 signals that we use to trigger ON/OFF activity.

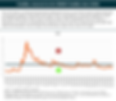


What is the ideal market environment for this trend process to work? In backtesting, this adaptive risk management process has demonstrated to work well in 3 of the 4 possible market environments.

Trend analysis as a risk management tool can help reduce portfolio drawdowns. The degree of account value declines during the past few years has been noticeably reduced by this risk management process.

Long-term historical results of trend based risk management are noteworthy. The cumulative return of the Adaptive Wealth U.S. Risk Management Index has resulted in higher ending values AND lower average portfolio drawdowns than the S&P500 (1999-2020).

Why not stay invested all the time?
When the market endures large losses, it takes much higher returns to just get back to even. Behavioral finance studies show that people have a larger emotional response to losing than they do winning. A byproduct of this human instinct is that when investments lose value, we are tempted to take action, usually the action of selling. The more people sell, the more a selling frenzy can ensue. Research shows that more than 80% of the worst days in the market have occurred when the market is trading below its 200-day average. (Source: Portfolio visualizer data 1/1/85 through 4/20/20)

The impact of losses: What this shows us is that we need to make far higher positive returns to get back to 0% if we experience large negative returns. The greater the loss, the longer it takes to recover.

Trend Analysis provides another approach
In understanding that most of the worst days seem to occur when the market is trading below its 200-day trailing average AND avoiding losses is more important than just earning high returns, the concept of "win by not losing" is born. When we blend findings from behavioral economics and statistics, the goal becomes:
Own stocks (Risk On) when the market is trading consistently above its recent average, AND
Be on the sidelines (Risk Off) when the market trades below its recent averages.
Missing the best and the worst days in the stock market has produced higher returns over the past 35 years than buy and hold strategies. Research provided by Ritholtz Wealth Management and data verification by Portfolio Visualizer 1985-2020.
Should this strategy be used as a complete portfolio solution?
In our opinion, no. This defined risk strategy should be used in conjunction with a diversified asset allocation strategy. There are many ways to diversify an investment portfolio against market risks. This particular strategy is simply designed to create a short term "floor" on the portion of a portfolio that is invested in the broad stock market. If one were to use this strategy exclusively, many of the long-term benefits of diversification would be lost. Additionally, this strategy does not work well in a very volatile, but fundamentally sideways market cycle because of trading costs and execution issues associated with the specific timing of the trades in and out of risk assets.
How much does it cost?
Running this strategy is surprisingly inexpensive compared to most actively managed investments. Because we can combine the low cost of indexing with a low number of expected trades each year, we find that the total cost to run this strategy is between 0.09% and 0.35% depending on which ETF or fund we use for domestic and international stock exposure. There are some labor costs for us to monitor various triggers, but we absorb that as part of our standard account service costs or advisory fees.
Can this strategy work over the long term too?
Interestingly, the results of this approach over the long term are quite similar to what we have seen recently. Typically, this defined risk strategy would have triggered a "risk-on" status about 70% of the time and "risk-off" about 30% of the time during the past decade.
Be sure to ask your advisor to provide you with more information on how you can take advantage of the AFP Defined Risk Strategy.

All investing involves risk, including the possible loss of principal. There is no assurance that any investment strategy will be successful.
A diversified portfolio does not assure a profit or protect against loss in a declining market.
Additional risks are associated with international investing, such as currency fluctuations, political and economic stability, and difference in accounting standards.